Independent academic reference · deltavolumedocs.org
The mathematics of statistics and probability
Delta Volume Docs is an independent academic reference devoted to the mathematical foundations of statistics, the geometry of probability densities, stochastic series in time, and the Gaussian normal law. Every page is written for quiet study rather than for practice: definitions are stated carefully, theorems are given with their conditions, and the reasoning is carried through in a calm, theoretical voice.
A reference built around definitions
The subject treated here begins with a simple premise: probability is a measure, and a random variable is a measurable map. From those two ideas an entire architecture unfolds. Sample spaces carry events, events carry a probability measure, and random variables translate outcomes into number lines on which expectation and variance become integrals. When those integrals are indexed by a second axis of time, we arrive at stochastic series, and when several variables are carried together we arrive at vectors and their matrices of covariance.
Our treatment keeps the academic focus narrow. We do not describe any commercial service and we publish no data of our own. Instead, each entry states the object under study, gives its law or its moments, and then explores the properties that follow. A reader should be able to move from the axioms, through the classical families of distributions, into the multivariate setting, and finally into the analysis of series and the spectral view of dependence, all without leaving the theoretical ground.
Why the Gaussian occupies so much of the page
No single law recurs as often as the normal distribution. It appears as the limiting form of sums, as the maximum of entropy under a variance constraint, and as the natural companion of the central limit theorem. Because of that, the normal density acts as a compass for the whole subject. Once its quadratic exponent is understood, the multivariate normal follows almost mechanically: the exponent becomes a quadratic form, the variance becomes a covariance matrix, and the contours in the plane become ellipses whose axes are fixed by the eigenvectors of that matrix.
The dependence between several variables is then summarised by a correlation matrix, a standardised object whose diagonal entries are one and whose off-diagonal entries lie between minus one and one. Such a matrix is symmetric and positive semi-definite, and those two properties alone explain why some lists of coefficients can occur and others cannot. This is one of the quiet beauties of the subject: a small algebraic requirement rules out a great many arrangements.
Foundations and first principles
The foundations page sets out the axiomatic base. We begin with a sample space of all outcomes, single out a family of events closed under complements and countable unions, and place a probability measure upon it that returns one for the whole space and adds across disjoint parts. Random variables are then measurable maps from that space to the real line. Expectation is defined first for simple maps and extended by a limiting argument; variance follows as the expectation of the squared deviation from the mean.
From there the study widens. Probability distributions are separated into the discrete family, where mass sits on single points, and the continuous family, where probability is carried by a density and only intervals have positive measure. The cumulative distribution function then serves as a common language: it is non-decreasing, right-continuous, and runs from zero to one, whether or not a density exists.
Series, stationarity and spectra
A stochastic series is simply a family of random variables indexed by time. The questions that matter are about dependence: does the law stay the same when the clock is shifted, and does the autocorrelation fade as the lag grows? Weak stationarity fixes the mean and the autocovariance structure; strict stationarity fixes the entire joint law. When the decay is fast enough, the series admits a spectral density, and the same object can be read either as a function of lag or as a function of frequency.
Excerpts from the questions we are asked
What does this reference cover?
It covers the mathematical theory of probability and statistics: the axioms of probability, families of distributions, the Gaussian normal law, matrices of covariance and correlation, stochastic series, stationarity, autocorrelation and spectral analysis, together with estimation and hypothesis testing. The tone is academic throughout.
Is any data distributed here?
No. The pages contain only explanatory prose and self-drawn figures. Nothing is uploaded, offered or served from this reference; the material exists for study and citation.
How should the notation be read?
A capital letter denotes a random variable, a lowercase letter a realised number, and σ denotes a standard deviation while μ denotes a mean. A matrix is written in bold and its entries carry two indices, row then column.
A worked figure
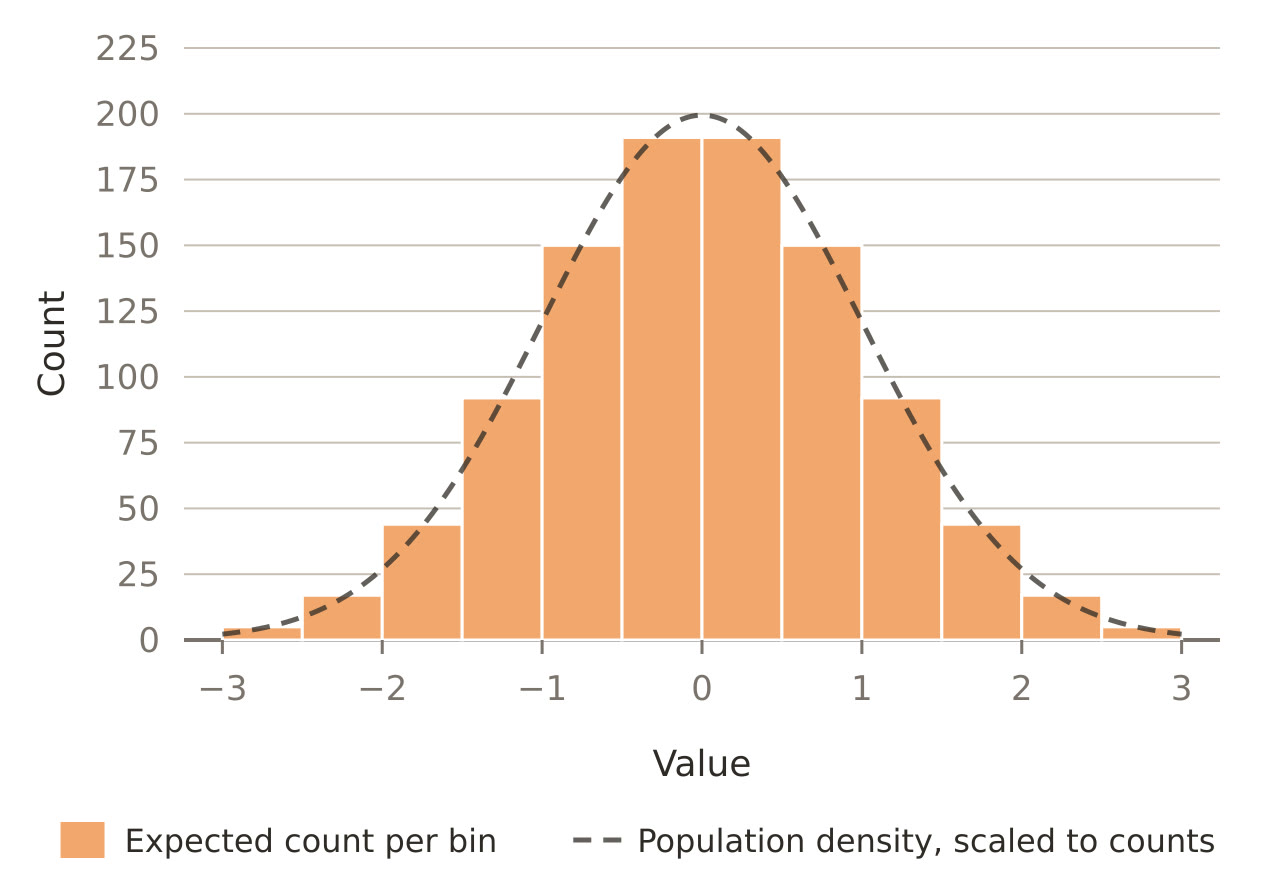
The picture below shows a simulated histogram of many independent draws placed beside the bell-shaped curve that theory predicts for their sum. As the count grows, the stepped outline of the histogram moves closer to the smooth curve. This is the central limit theorem made visible, and it is the reason so much of applied reasoning leans upon the normal law.
Readers who wish to go further may consult the glossary of statistical terms, which gathers the vocabulary used across the site, or the editorial page, which explains how the material is prepared and checked. Both are linked from the bar rail above and from the index at the foot of every page.